Be it Adverse Event Detection, Technology Scouting or Covid Patient Data Analysis – Over the past 15 years we have extracted, categorized and made accurate predictions from tons of unstructured data. This has brought us several awards and more than 100 satisfied customers in the healthcare and life science industry. Besides, we have invested heavily in the research and development of medical text mining and published our results in relevant journals. Technologically we also keep up with the times e.g., from this summer on you can run 3rd party Python models on our products and much more (Look forward to the new major release). So, it is fair to say that we are a very good address for Natural Language Processing (NLP) in the healthcare and life science industry. Although we were always a bit behind in the area of graphics and data visualization …until now!
In order for our customers to not only have their data available in a structured way, but also to make analysis easier, we have linked our products to popular BI tools. Specifically, we built a connector for Tableau and added a simple tutorial to set up Power BI – ready in just a few minutes. We made a conscious decision to offer data preparation and visualization via common BI tools, as most customers already have them, and their employees are already familiar with how to use them. By doing this we continue on our journey to make text analysis as easy as possible for as many companies as possible, without the need of a special programming or data science background.
In the following, we will show you two examples from our existing use cases. Showing how these tools can provide clear and meaningful visualizations at the push of a button. (Please note that both PowerBI and Tableau can be used for all our products).
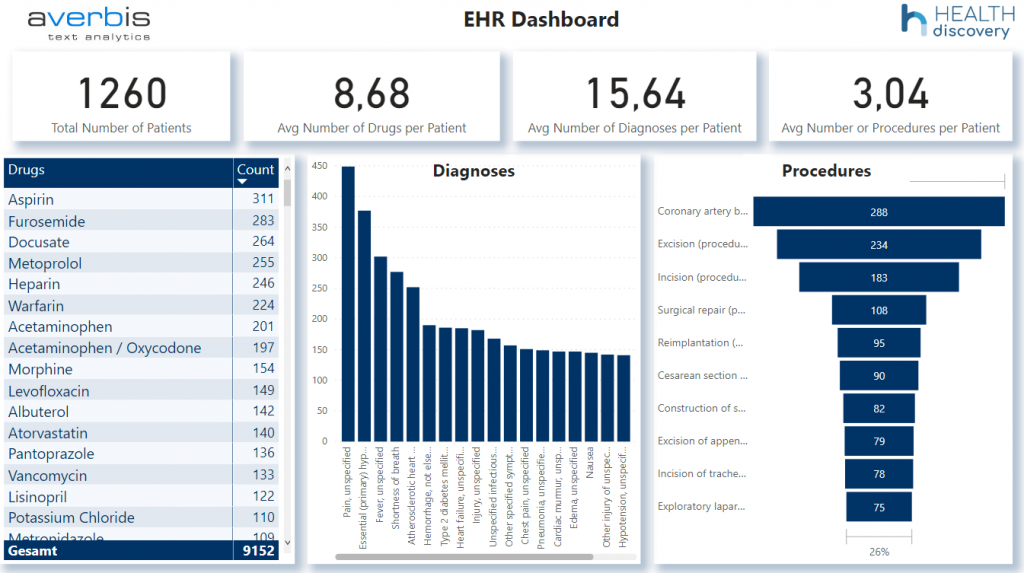
With Averbis Health Discovery, you already have the ability to quickly gain meaningful insights into important key metrics of your EHR database. With the addition of PowerBI support, you can now get these insights in a visual format providing you with a better overview of your analytics. You can now simply select the metrics you want to visualize from your Health Discovery search results and create your own personal dashboard. Instead of working through lists of, say, diagnoses or procedures, the visualization allows you to quickly spot trends and outliers in your data sets. This makes it much easier to understand the results. Moreover, you can export these visualizations directly to use them in presentations, scientific papers or similar. This way you can give others a quick and complete overview of your results.

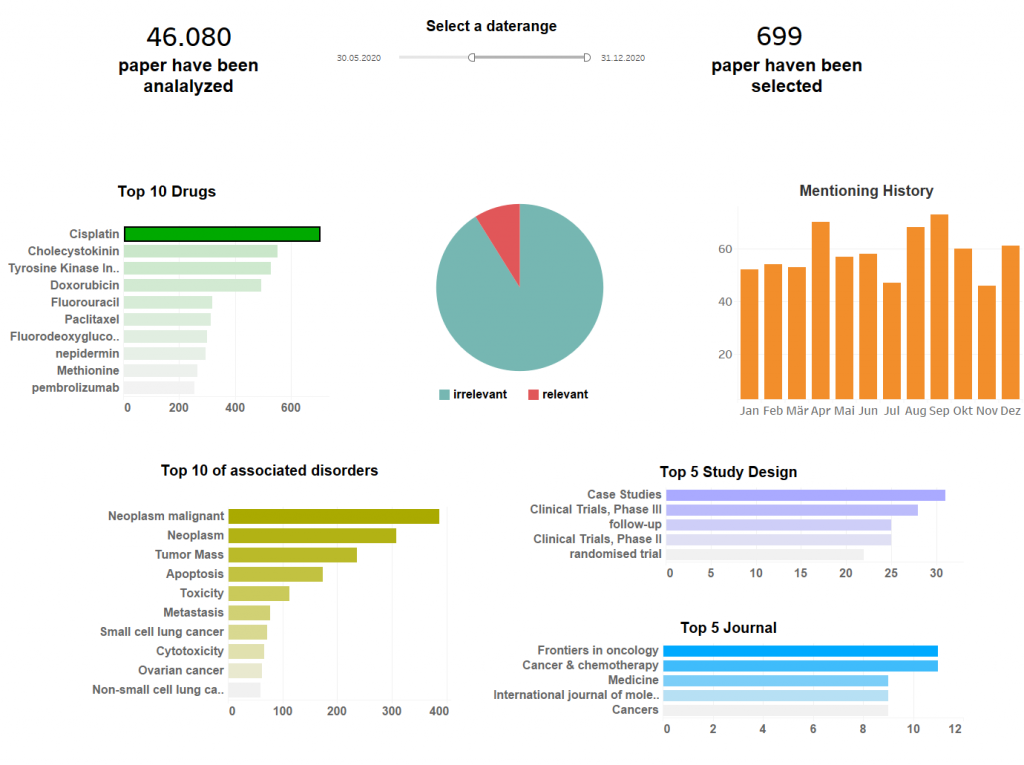
One of our most popular use cases for the Averbis Information Discovery Platform is the automated literature classification of scientific papers. The applied combination of NLP and Machine Learning reduces the effort for internal experts or external service providers by up to 85%. With the added capabilities of data visualization through PowerBI or Tableau, they can save even more time while getting meaningful insights. Below is a sample dashboard of a literature classification regarding adverse event detection. The interactive Tableau dashboard allows you to get a quick and complete overview of key metrics. You can select which key metrics you want to see and get more detailed views by drill-down menus. Additionally, you can select filters, such as the time period of publications to include in your analysis, by using the slider in the middle. This doesn’t only make it look better, but also saves you time when arranging and customizing your searches.

With direct connections to Power BI and Tableau, you can get even more insights out of your unstructured data, so that we can confidently say:
For more information on Power BI integration, click here. For information regarding the connection to Tableau or other questions please send us an email to sales(Replace this parenthesis with the @ sign)averbis.com or use our contact form.

